RightMark Audio Analyzer test report
| Testing device | AlansDCG3Test2 |
| Sampling mode | 24-bit, 48 kHz |
| Interface | |
| Testing chain | External loopback (line-out - line-in) |
| RMAA Version | 6.4.5 PRO |
| 20 Hz - 20 kHz filter | ON |
| Normalize amplitude | ON |
| Level change | -0.1 dB / -0.2 dB |
| Mono mode | OFF |
| Calibration singal, Hz | 1000 |
| Polarity | correct/correct |
Summary
| Frequency response (from 20 Hz to 20 kHz), dB | -0.03, -0.05 |
Excellent |
| Noise level, dB (A) | -109.8 |
Excellent |
| Dynamic range, dB (A) | 109.8 |
Excellent |
| THD, % | 0.00117 |
Excellent |
| THD + Noise, dB (A) | -95.5 |
Excellent |
| IMD + Noise, % | 0.00142 |
Excellent |
| Stereo crosstalk, dB | -77.8 |
Very good |
| IMD at 10 kHz, % | 0.00163 |
Excellent |
| General performance | Excellent |
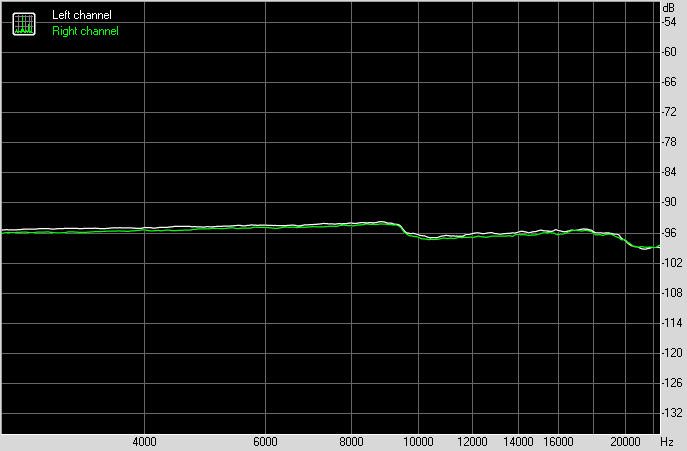
Frequency response
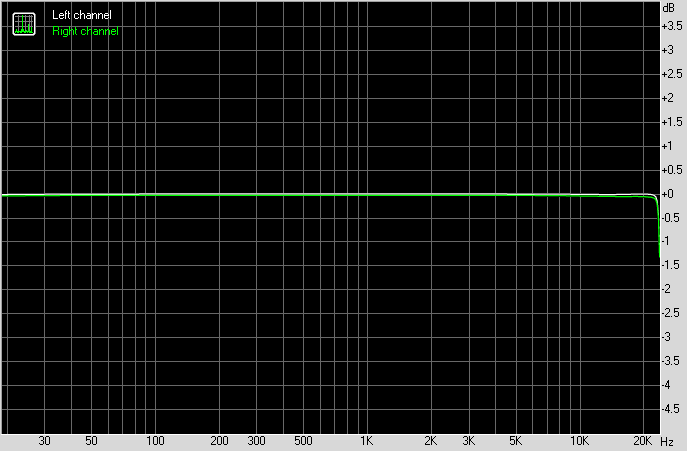
Left |
Right |
|
| From 20 Hz to 20 kHz, dB | -0.01, +0.00 |
-0.05, -0.03 |
| From 20 Hz to 20 kHz, dB | -0.01, +0.00 |
-0.05, -0.03 |
Noise level
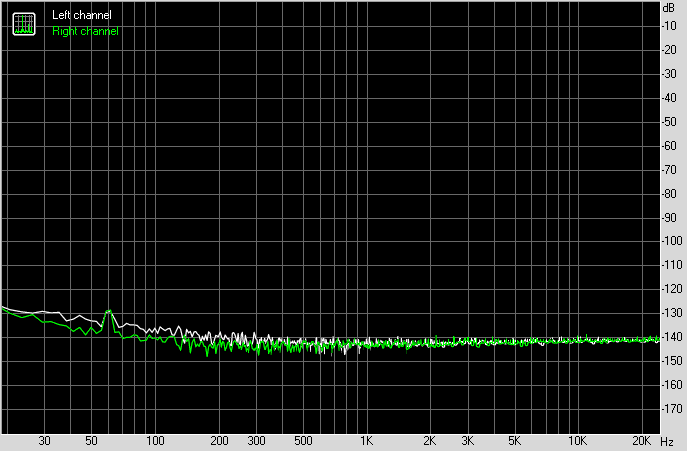
Left |
Right |
|
| RMS power, dB | -108.6 |
-108.8 |
| RMS power (A-weighted), dB | -109.8 |
-109.9 |
| Peak level, dB FS | -80.1 |
-79.3 |
| DC offset, % | +0.0 |
+0.0 |
Dynamic range
Left |
Right |
|
| Dynamic range, dB | +108.5 |
+108.7 |
| Dynamic range (A-weighted), dB | +109.7 |
+109.9 |
| DC offset, % | -0.00 |
-0.00 |
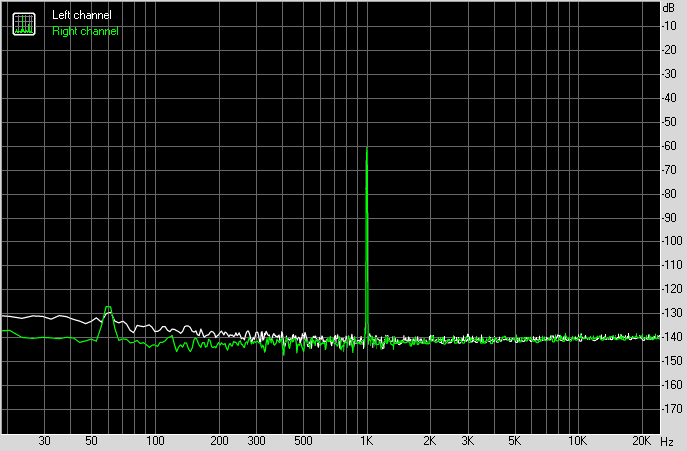
THD + Noise (at -3 dB FS)
Left |
Right |
|
| THD, % | 0.00124 |
0.00110 |
| THD + Noise, % | 0.00146 |
0.00133 |
| THD + Noise (A-weighted), % | 0.00176 |
0.00158 |
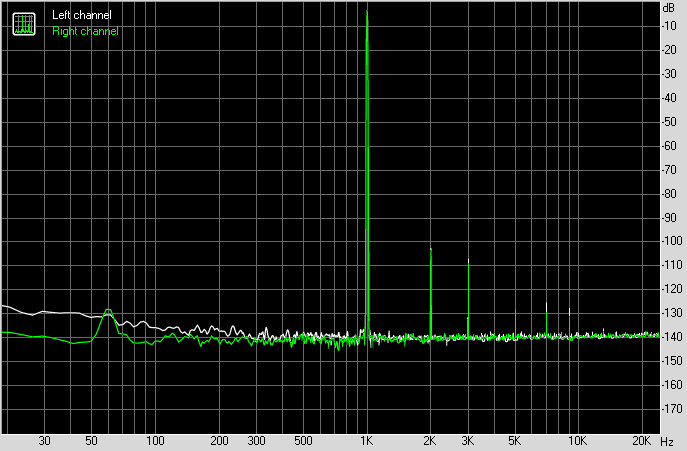
Intermodulation distortion
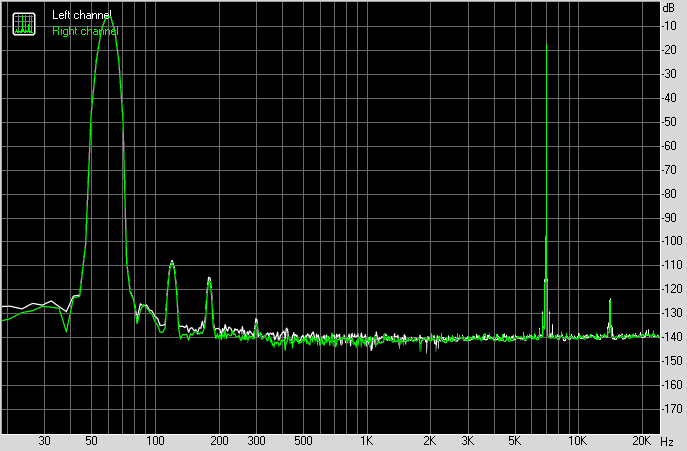
Left |
Right |
|
| IMD + Noise, % | 0.00147 |
0.00137 |
| IMD + Noise (A-weighted), % | 0.00113 |
0.00107 |
Stereo crosstalk
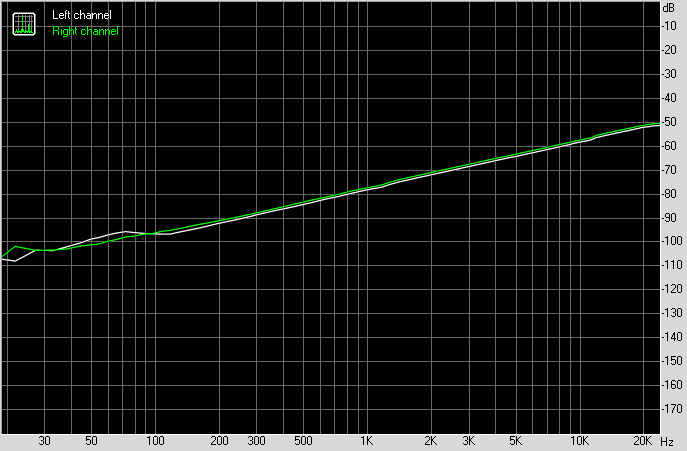
Left |
Right |
|
| Crosstalk at 100 Hz, dB | -96 |
-95 |
| Crosstalk at 1000 Hz, dB | -77 |
-76 |
| Crosstalk at 10000 Hz, dB | -57 |
-56 |
IMD (swept tones)
Left |
Right |
|
| IMD + Noise at 5000 Hz, | 0.00182 |
0.00175 |
| IMD + Noise at 10000 Hz, | 0.00153 |
0.00144 |
| IMD + Noise at 15000 Hz, | 0.00168 |
0.00155 |